Australia's Road Toll — verified report · ask.crashstats.com.au · crashstats.com.au

Australia's road toll: past the peak?

A verified, queryable report. The national rolling 12-month toll peaked in October 2025; whether a genuine decline has begun is a live question — so we published the evidence, the caveats, and the tests that would prove us wrong, and wired an assistant that answers only what the data can support.

Every number machine-verified · refuses when unverifiable BITRE ARDD to 31 May 2026 · TAC daily to 10 Jul 2026
The published post

Who moved Australia's road toll?

Australia's road toll needs national attention — but the lessons are hiding at state level.

The AAA's latest benchmarking bulletin is out (12 months to 31 May 2026): 1,332 lives lost nationally, up 0.8%. The chart below shows who actually moved that number — and Victoria is the standout: 267 lives lost, down from 299. The largest fall of any jurisdiction, the lowest fatality rate of any state (3.7 per 100,000), and the single biggest contribution holding the national figure down.

Full disclosure: I'm biased! I contribute to Road Safety Victoria's data work, and I'm proud of that.

Victoria shares its road safety data openly — crash records, dashboards, the lot. Open data doesn't only serve analysts; it quietly shapes public knowledge, vigilance and caution. I can't prove that link caused this year's numbers — nobody honestly can yet — but transparency is the precondition for every intervention that does work.
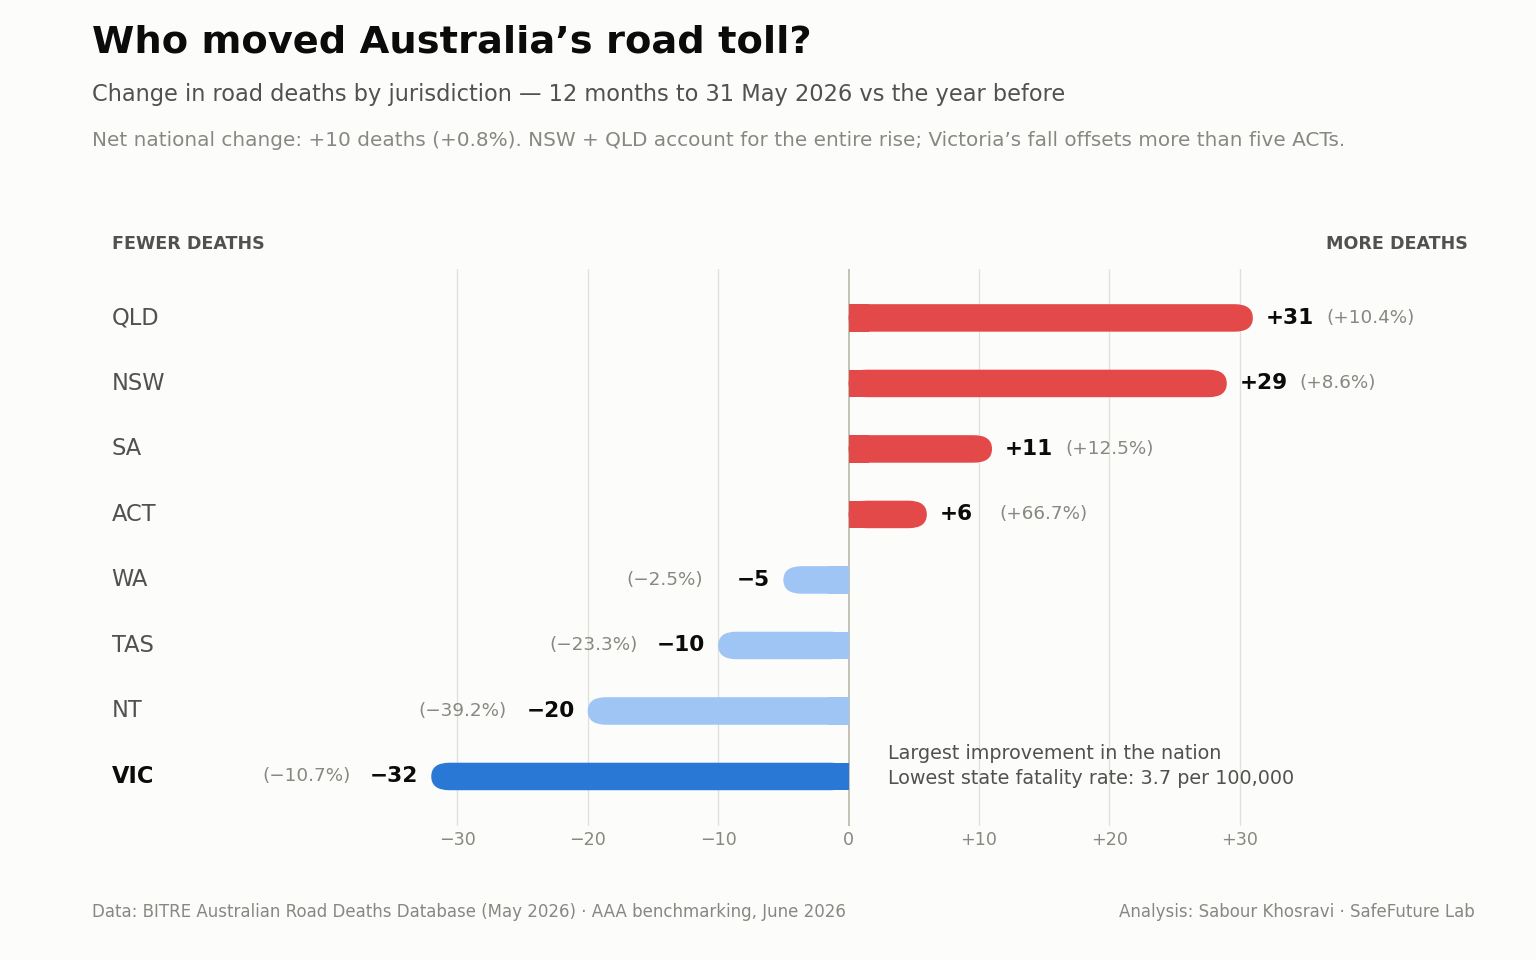
Diverging bar chart: change in road deaths by jurisdiction, 12 months to 31 May 2026 vs prior year. QLD +31, NSW +29, SA +11, ACT +6, WA −5, TAS −10, NT −20, VIC −32.
The published chart. Net national change +10 deaths (+0.8%); Victoria's fall offsets more than five ACTs.
What the Victorian data shows

Victoria's turn is the newest and steepest of the big states

Victoria's rolling 12-month toll peaked at 301 in October 2025 and stands at 267 — and the fall has continued past the BITRE window: TAC's daily series has 2026 running well below 2025.

VIC 12-month toll BITRE
−11.3%
301 (Oct 2025 peak) → 267 (May 2026)
VIC 2026 year-to-date TAC
−21.6%
131 v 167 lives lost, to 10 July 2026
Motorcyclists TAC
−52%
2026 YTD vs same period 2025
100+ km/h zones BITRE
−24%
12m to May 2026 vs prior, coded records

The fall concentrates where Victoria's post-lockdown excess lived: high-speed zones, regional roads (−33% vs Melbourne's −14% in the latest 12-month window), and younger male drivers (−21% in calendar 2025). A 25-year Monash time series (Lim 2025, Journal of Public Health, doi:10.1007/s10389-025-02611-0) documented that elevated post-lockdown fatality regime; the 2025–26 data are consistent with it unwinding.

Honest caveats. The newest months carry coding lag — speed-zone and remoteness fields are incomplete for recent records, so composition splits are provisional (totals are not). Passenger deaths rose against the trend. TAC daily figures are provisional and revised. Remoteness uses ASGS 2021 boundaries; volatility analysis is restricted to years with ≥95% coverage (2017–2025). And Victoria's fall is young: the falsification gates below are the test, not our confidence.

The gates that would prove this wrong

GateLocked dateSupportsWeakensRejects
Victoria rolling-1230 Nov 2026≤ 267268–300≥ 301 (back at peak)
National rolling-1230 Nov 2026≤ 1,3321,333–1,350≥ 1,351 (new peak)
Persistence, national31 May 2027≤ 1,300 and ≥6/12 months below prior year1,301–1,332any new peak

Pre-registered 23–24 July 2026. No "safer roads" claims will be made unless the fatality rate per vehicle-kilometre also falls — it currently sits at a decade high (5.0 per billion km, FY2024-25).

The national picture

A two-track story, not a clean decline

Nationally, the rolling 12-month toll peaked at 1,351 in October 2025 and printed 1,332 in May 2026 (−1.4%). That aggregate is statistically flat — but its composition is not. The components that spiked after COVID are receding, while urban walking and cycling deaths rise and mask them:

100+ km/h zones
−6.5%
2024 → 2025, largest absolute fall BITRE
Remote single-vehicle
−36%
80 → 51 deaths, ≈3.3σ BITRE
Young males 17–25
−4.7%
while all other groups rose +2.6% BITRE
Pedestrians
+12.1%
and cyclists +38% (small numbers) BITRE
Aug 2024 Apr 2026 NT−54% TAS−28% WA−6% VIC−11% NSW−2% SA·QLD−1–3%
When each jurisdiction's rolling-12 toll peaked (dot position) and how far below that peak it now sits. Blue = well past peak; red = only just off peak. The turn is rolling through the country, not arriving at once.
The international parallel. The United States ran the same arc two to three years ahead of Australia: a pandemic-era fatality spike that NHTSA attributed to speeding, risk-taking and reduced restraint use, followed by decline — US road deaths have fallen every quarter since mid-2022 (39,345 in 2024, −3.8%; 2025 estimated down a further ~6.7% NHTSA), and the WHO's 2026 global status report puts worldwide road deaths down 9% WHO. The categories now receding in Victoria and nationally — high-speed zones, younger drivers, single-vehicle crashes — are the same signature that spiked and then receded in the US. A pattern parallel that makes the Australian turn more credible; not proof of cause.
What we don't claim. The national turn is not yet statistically significant. Regional single-vehicle deaths rose 15.8%, breaking a clean geographic gradient — that may be lag, a separate risk factor, or noise. Probable contributors in order of defensibility: mean-reversion after the 2022–23 step (the null we keep named), remote-area and NT-specific measures where the geography fits, Australia joining the international post-COVID fatality retreat late (US down every quarter since mid-2022; WHO reports a 9% global fall), with enforcement technology and fleet safety (AEB mandates) as slower background factors. Causal attribution beyond that is not available in this data.
Interrogate the report

Ask the data yourself

The assistant answers only from this report's tables: it drafts read-only SQL and a deterministic verifier checks every number against the query results before you see it. If it can't verify, it refuses. Use the button at the bottom-right, or start from a question:

Road Toll Report AI Assistant
Answers only from this report's data — every number machine-verified before display.
G'day — ask me about the road toll: rolling totals, five-year trends, state contributions, volatility, remoteness, rates per kilometre travelled, or the report's methods.
Educational report assistant by Sabour Khosravi (GoldNet Engineering Group). Independent of BITRE, TAC, the AAA and all governments. Not engineering advice. Questions may be reviewed to improve accuracy.